
Using Quantitative Finance to Regulate Exposure to Gold
Overview
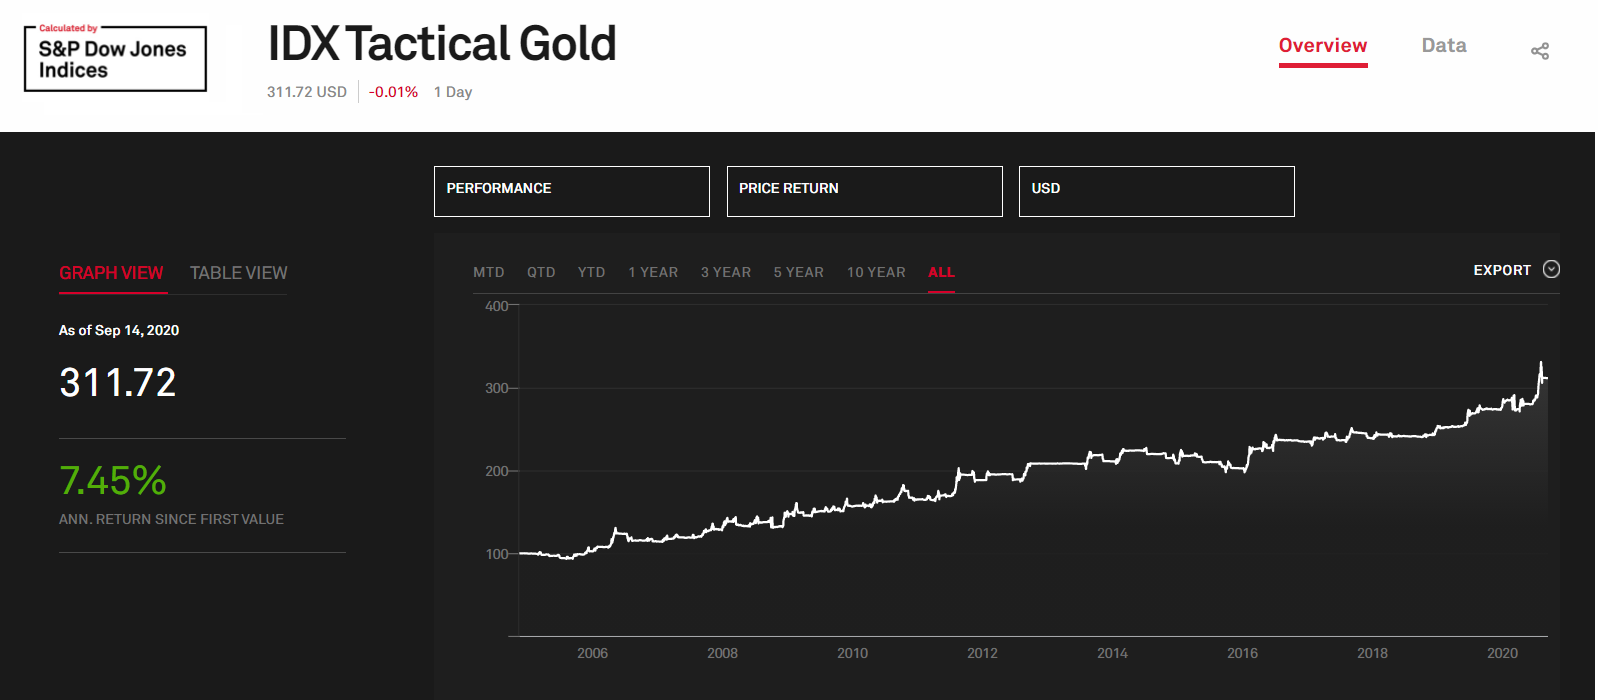
The IDX Tactical Gold Index (IDXGOLDX) seeks to provide tactical upside participation to Gold (using exchange traded products) while limiting drawdowns and downside volatility. The data shown is from the IDX Tactical Gold Index as priced by S&P.
The IDX methodology tactically manages exposure to gold assets. The goal being attractive risk-adjusted returns relative to a long-only position in gold over time. Price changes determine when short-term momentum is positive and accelerating. The objective of the strategy is to opportunistically deploy risk capital to gold ETPs (ETFs and/or ETNs) when the risk-return profile of gold is favorable. Likewise, the strategy seeks to preserve capital when the risk/reward profile is unfavorable through an allocation to short-term fixed income ETFs (such as IDX Managed Duration Index).
The Methodology
The objective of the IDX methodology is to acquire long exposure to Gold assets at those times when the risk/return profile is disproportionately skewed to the upside. It’s not enough that gold is simply “going up” …it must be going up at an increasing rate.
By design, this presents a relatively high bar for participating in gold. Similarly, a relatively low bar is set for taking risk OFF the table. As soon as either the price momentum of gold or the momentum of momentum of gold begins decreasing, the index allocates 100% to short-term fixed income ETFs (such as the IDX Managed Duration Index)
Note: The Tactical Gold Index shown in the above video assumes the “risk-off” position is the iShares 1-3 yr Treasury Bond ETF (SHY).
Note: The Tactical Gold Index shown in the above video assumes the “risk-off” position is the iShares 1-3 yr Treasury Bond ETF (SHY).
F.A.Q.
What Data is used to generate the signals?
Signals for Tactical Gold are generated using the price of the SPDR Gold ETF (GLD).
Is GLD an ETF? How does it trade?
The IDX Tactical Gold strategy can use any number of ETPs to get long exposure to gold but generally it can be expected to use the SPDR Gold Trust (GLD) which is the most popular gold ETF. Because GLD is an exchange traded fund, it trades just like a stock (intraday, 5 days a week). For more information refer to this page at State Street.
What happens when the signals “go to cash”?
The “risk off” portfolio (as we call it) can be anything but will generally be a cash proxy such as the Barclays Aggregate Bond ETF (AGG), the iShares 1-3 yr Treasury Bond ETF (SHY) or the IDX Managed Duration Index which is a diversified basket of fixed income ETFs. The video above, for example, assumes the cash position is placed in the Barclays Aggregate Bond ETF while the interactive charts at the top of the page assume the iShares 1-3 yr Treasury Bond ETF (which is what’s currently in place on SMArtX).
This index seeks to provide current income with superior risk-adjusted returns and lower duration relative to long-only fixed income benchmarks. The objective in using this as the “risk-off” allocation is that a yield can still be harvested while waiting for the Tactical Gold allocation to go long.
When did the Tactical Gold model go live?
The IDX Tactical Gold model went live internally on July 1, 2019 (the same as our COIN model). The model was deployed on SmartX on June 1, 2020. All returns prior to that date should be assumed to be hypothetical (and unless otherwise noted) GROSS of any fees or transaction costs.
Can you provide daily data since the live date?
Yes, if you are a professional investor. Please contact us at info@idxinsights.com for more information.
Can you customize this Index?
Yes, depending on investor risk profile and objectives, the index can be tailored.
How can I invest?
The index is currently only available to RIAs via separate accounts. Please contact benjacobson@idxadvisors.com for more information.B